Lead Generation For B2B Using LinkedIn & Google Analytics

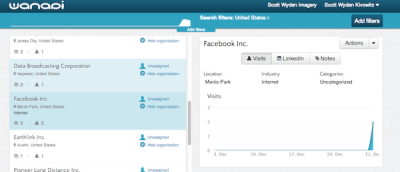
Wanapi is a new tool well worth checking out for any photographer focused on businesses or business people as your customers.

Wanapi connects to your Google Analytics and shows you interesting b2b sales leads. You can see which companies visited your website, when and what they did there.

With it, you can literally connect your Google Analytics and LinkedIn accounts to the application. Then, it analyses the data and shows you which businesses were on your site, why and what they were doing.

Here are some screenshots.

wanapi-01

The basic default screen lets you browse the companies, and clicking on a company brings up the traffic.

wanapi-02

Clicking on the LinkedIn tab brings up employees at the company and their connection to you.

wanapi-03

You can then hide the company, add notes, show what pages the people visited and categorize the lead.

wanapi-04

Hovering over the chart will bring up more information that can be useful for your outreach to the new lead.

So there you have it. Wanapi is pretty neat and very new. The basic account is free, but looks as though they will be adding price levels in the future.

Thanks for reading,

Scott

Getting Social With Google Analytics

google-analytics

Google Analytics is getting social, as it is now tracking likes, +1s, Pins, etc.

The social features are still fairly new, and growing often.  In the video below you will see how to further enhance the social functionality.

Grab the Social Media Dashboard for your Google Analytics account.  Don’t forget to start digging into the data outside of the dashboard.

Go to:  Traffic Sources >> Social:

  • Overview
  • Sources
  • Pages
  • Conversions
  • Social Plugins
  • Social Visitors Flow

Do you find the Google Analytics social information useful, pointless, fun?  Feel free to comment with your thoughts.

Thanks for reading,

Scott

On Having A Blogging Strategy

blogging-strategy

I read an article from a very well known copywriter, Jon Morrow.

Jon is best known for his work with Copyblogger and his Headline Hacks cheat sheet.

The article talked about how posting every day is a silly strategy.  I commented that I had been blogging every day for over a year and I was willing to give lesser a try.

So I did…

Since the end of March, I have been posting 2 articles a week instead of 5.  I looked through my Google Analytics statistic to find the best day to post – and that’s the direction I went.

Well, as it turns out, it may not have been the best strategy.

Or is it?

blogging-strategy-analytics

As you can see in the screenshot, my traffic has been reduced gradually since the end of March.  There was a 20% decrease, which is pretty big.

Posting Less

By posting less, you have the ability to:

  • Increase social proof (social engagement)
  • Increase on-site engagement (commenting)
  • Increase subscriber counts (people want more)
  • Plan harder and write better
  • Promote longer
  • Create more valuable content (eBooks, Whitepapers, etc.)
  • Guest post for link building

Free Time

Yes, posting less opened up more free time to write elsewhere and to write better content, but my traffic has dropped.  Was it worth it?  Time will tell of course.

For some interesting insights into daily blogging and strategy, check out some of these articles:

If you would like help organizing your WordPress blogging strategy, we recommend giving the Editorial Calendar plugin a try.  It helps view your timing in a more recognizable format.

The new strategy experience made me wonder what strategy you have for you blog?

Are you posting once a week, twice a week, daily, monthly?

Comment below and share your strategy with the Photocrati community.

Thanks for reading,

Scott

Learn More About Your Own Blog

photography-website-analytics

Have you ever wanted an easy way to look at your blog’s statistics?

Thanks to the new Google Analytics Dashboard sharing feature, we are able to give you an overview of blog data.

First thing is to click here to access the blog dashboard.

What you’ll notice is some of the most important data drives your blog traffic.

  • Visits

basic-blog-dashboard

  • Visitors
  • Percent of new visits
  • Traffic referrals

traffic-drivers

  • Most popular pages/posts
  • Most popular landing pages/posts (where people first enter the website)
  • Non-branded keywords (you will need to edit this to match your own)

non-branded-keywords

  • Audience locations
  • Social Source and Action
  • Socially Shared Content

For more advanced users, there are two other sections of the dashboard.  However, these require goal creation.

  • RSS Subscription Rate
  • Time on Site Conversions

Once you’ve added the dashboard to your Google Analytics account, come back here and comment with questions you may have.

This is just one of the many Analytics tools we hope to share in the future.

Thanks for reading,

Scott